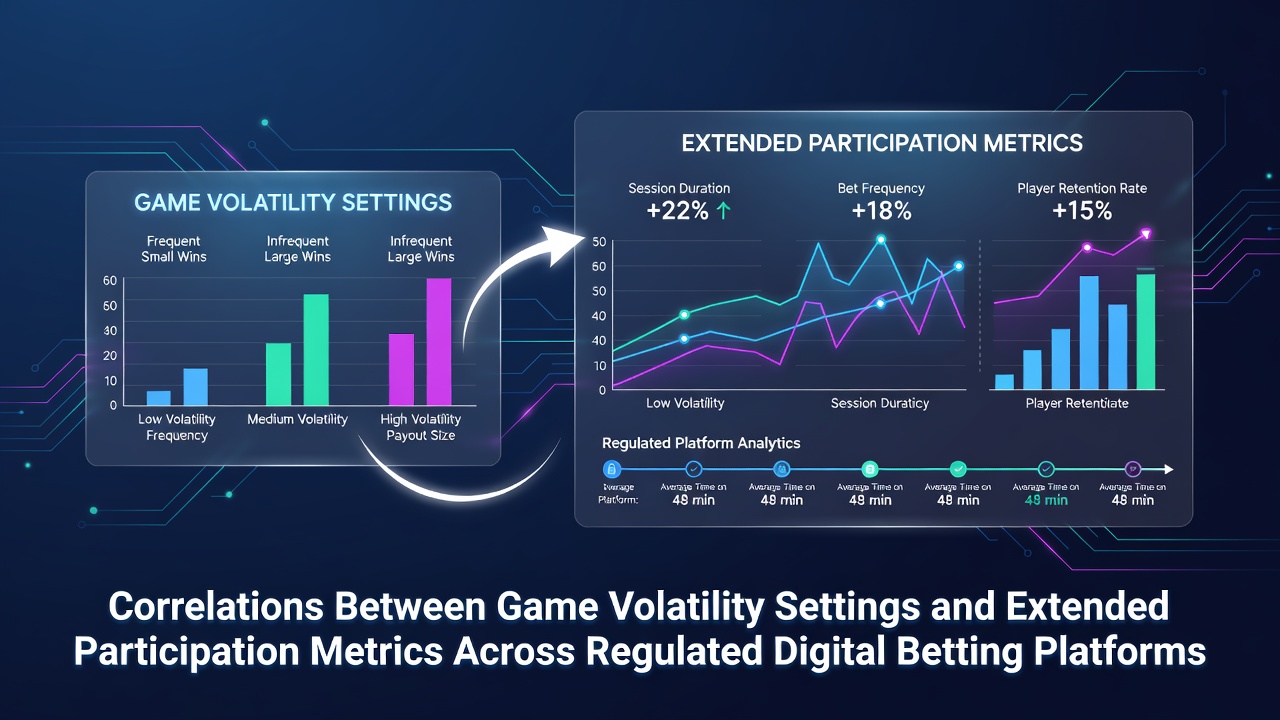
Correlations between game volatility settings and extended participation metrics across regulated digital betting platforms
Regulated digital betting platforms track game volatility as a core setting that influences how wins distribute across play sessions, and analysts examine its ties to metrics such as average session length, return visit frequency, and total time spent per account. High-volatility titles deliver larger but less frequent payouts while low-volatility options produce steadier smaller returns, and platform operators adjust these parameters within limits set by licensing bodies to meet compliance standards. Data collected from multiple jurisdictions shows measurable patterns where volatility levels align with shifts in how long users remain active on a given title or across an entire platform.
Defining volatility in digital betting environments
Game volatility refers to the mathematical distribution of payout outcomes built into slot mechanics, table variants, and instant-win products, with regulators requiring transparent disclosure of return-to-player percentages alongside volatility indicators. In practice, platforms categorize titles into low, medium, and high tiers based on hit frequency and prize size ranges, and developers tune random number generators accordingly. Those who've studied platform telemetry note that volatility settings interact with player bankroll management tools, including deposit limits and session reminders, which operators must implement under current licensing rules. What's interesting is how these settings remain consistent even as software updates roll out, allowing longitudinal comparisons of engagement data collected month over month.
Key participation metrics under review
Extended participation metrics include average session duration measured in minutes, the percentage of accounts returning within seven days, and cumulative playtime aggregated across thirty-day windows. Regulators in several regions require operators to submit anonymized summaries of these figures, and industry reports compile them to identify trends without exposing individual user data. According to figures released by the American Gaming Association in early 2026, platforms with diversified volatility offerings recorded higher aggregate session lengths compared with those offering predominantly one volatility tier. Observers note that these metrics also intersect with responsible gaming features such as reality checks and cool-down periods, which can truncate sessions regardless of volatility level.
Observed correlations across platforms
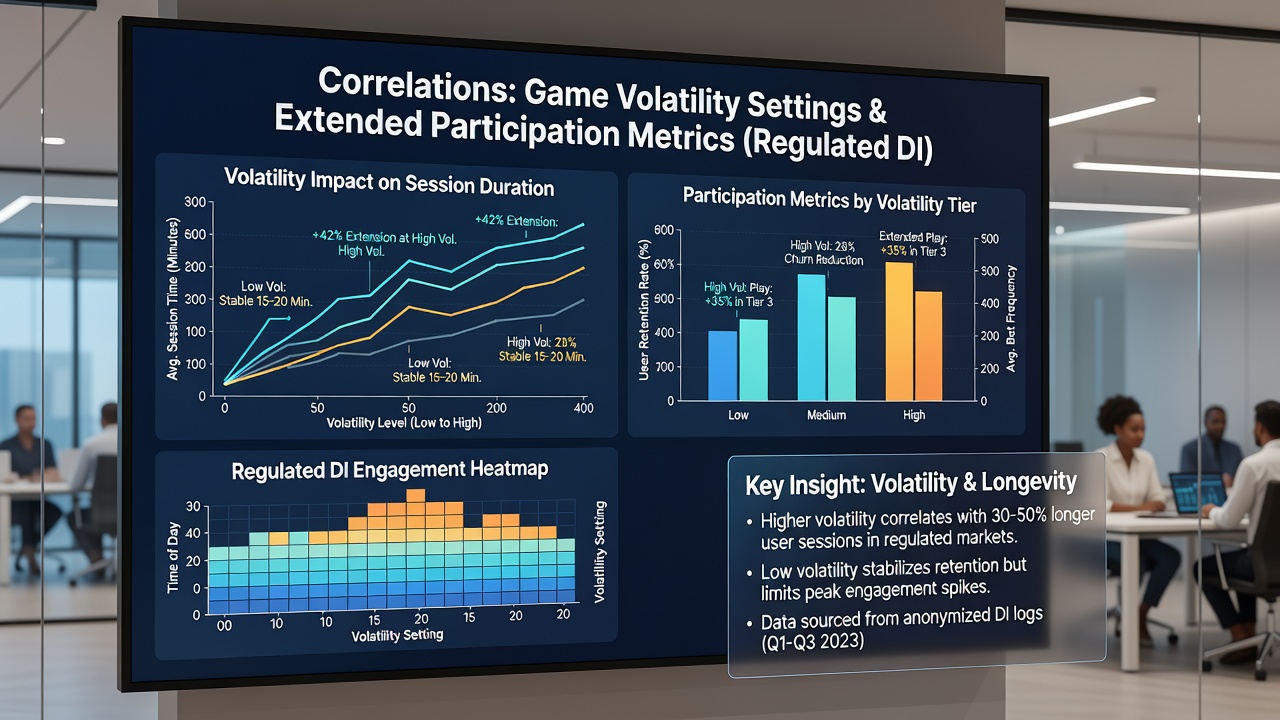
Studies of anonymized datasets from licensed operators indicate that medium-volatility games often correlate with the longest continuous play intervals, whereas high-volatility titles show spikes in shorter but repeated visits when jackpots reach certain thresholds. Low-volatility games tend to support steadier daily logins yet shorter individual sessions, creating a different retention curve. Researchers at the University of Nevada, Las Vegas documented similar patterns in a 2025 analysis of North American adn Australian platforms, where volatility adjustments coincided with measurable changes in thirty-day retention rates. But here's the thing: these correlations weaken when platforms introduce new promotional mechanics or when external events such as sporting calendars shift user attention, showing that volatility does not operate in isolation.
Regional regulatory influences on volatility settings
Licensing frameworks in different jurisdictions impose varying constraints on how operators present volatility information and whether they must offer balanced portfolios of game types. In July 2026, several Canadian provincial regulators updated reporting templates to include volatility breakdowns alongside standard retention statistics, allowing clearer cross-platform comparisons. European authorities have similarly required operators to segment performance data by volatility category when submitting quarterly compliance filings. These policy shifts enable researchers to isolate volatility effects from other variables such as bonus structures or payment method preferences, producing more granular datasets than were available in prior years.
Platform-level adjustments and data patterns
Operators periodically recalibrate volatility mixes in response to performance dashboards that track engagement alongside regulatory key performance indicators. One documented case involved a multi-state operator that increased the proportion of medium-volatility titles in its mobile lobby during the first half of 2026, after which internal reports showed an uptick in average session duration across the affected user cohort. Similar adjustments appear in reports submitted to the Nevada Gaming Control Board, where volatility distribution figures accompany other operational metrics. Those who've examined these filings observe that platforms with wider volatility ranges tend to maintain more stable participation numbers even during periods of regulatory tightening around bonus promotions.
Challenges in isolating volatility effects
Multiple confounding factors complicate direct attribution of participation changes to volatility alone, including simultaneous updates to user interface elements, payment flows, and responsible gaming prompts. Platform algorithms that recommend games based on past behavior can steer users toward certain volatility levels, creating feedback loops that influence the very metrics under study. Analysts therefore rely on controlled A/B testing environments approved by regulators to generate cleaner data, and results from such tests feed into broader academic reviews. The reality is that volatility remains one variable among many that together shape how long accounts stay active on regulated platforms.
Conclusion
Available data from regulated environments continues to map connections between volatility configurations and participation metrics, with medium-volatility offerings frequently linked to extended session lengths and high-volatility titles showing distinct return patterns. Regulatory updates in mid-2026 have expanded the granularity of required reporting, supporting more precise comparisons across jurisdictions. As datasets grow, researchers and operators alike gain clearer views of how these settings interact with broader platform design choices, all while remaining within established compliance boundaries.